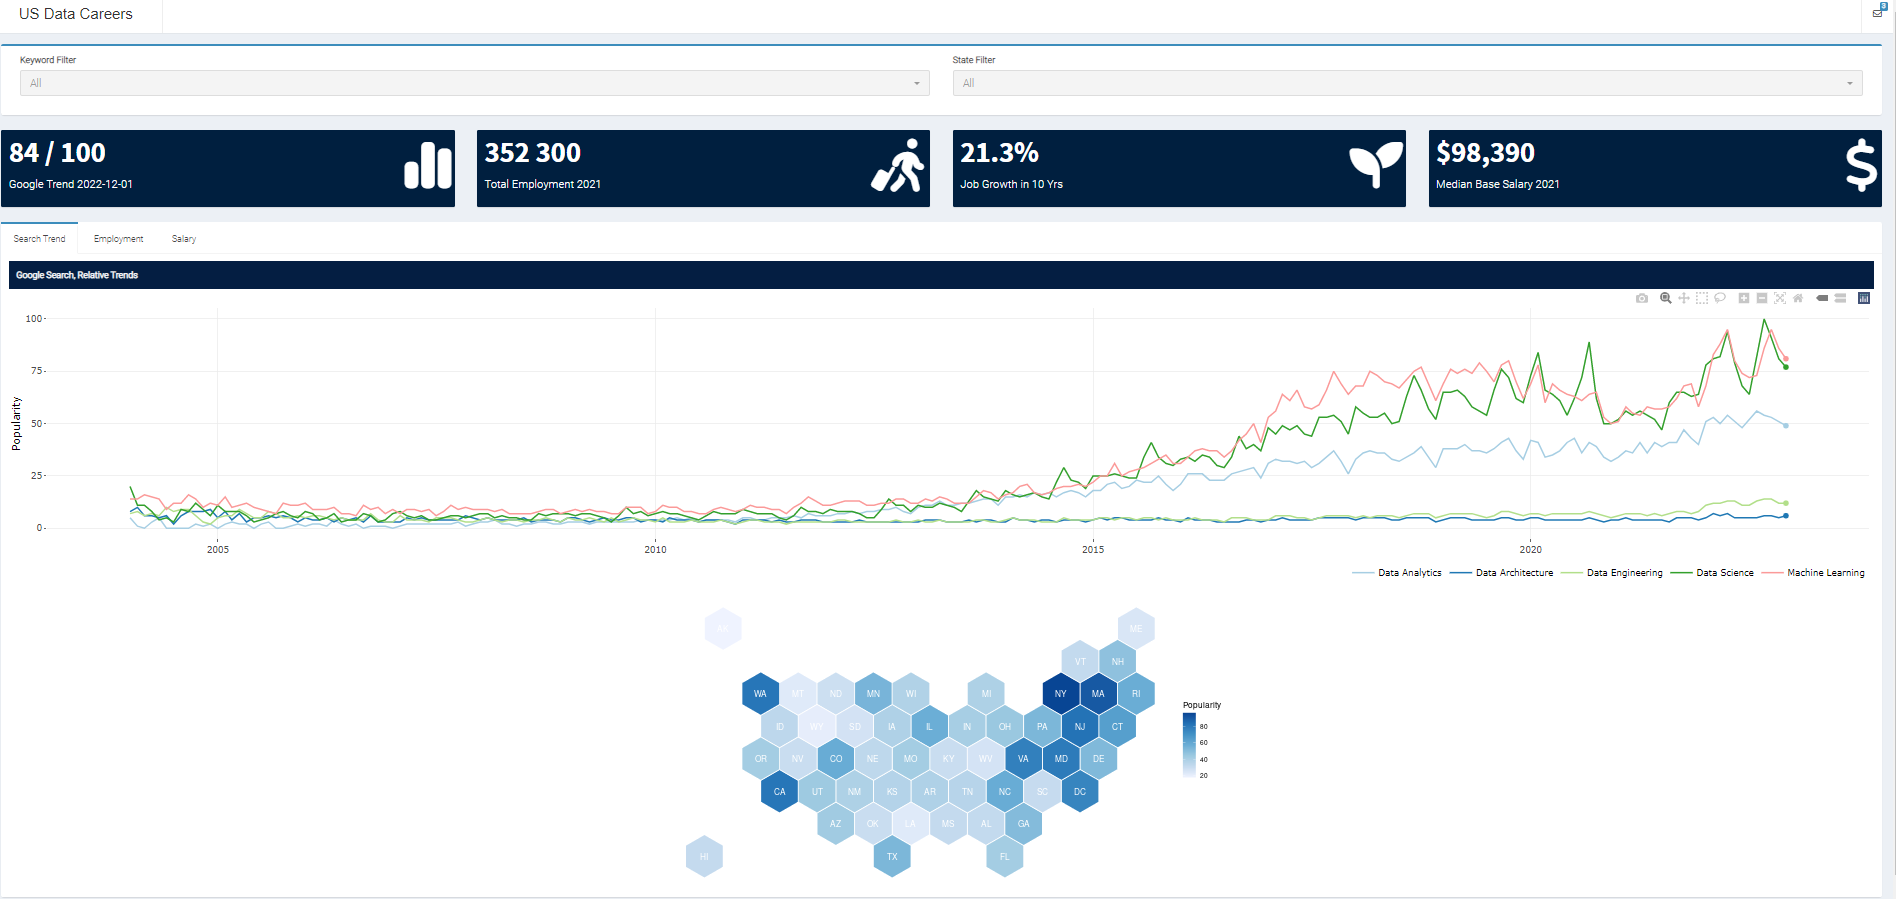
US Data Careers, Dashboard
As data practitioners, we have the unique ability to use automation and visualizations to stay current on the present and future outlook of our careers. Imagine being able to easily track and understand the trends shaping your profession - that's the power of data at your fingertips.
Tools Used
R
Category
Visualization / Automation
Date
December 27, 2022
Challenge
Automating and visualizing the current and future job outlook for data-related careers in the US to stay ahead of the curve and make informed career decisions.
Solution
Leverage R Shiny to build a dynamic dashboard that can be easily updated with the push of a button.